
The CoT Index represents the current net position of a market participant in relation to the highs and lows within a
freely selectable period. The default setting was 156 weeks (about 3 years).
However, this should be adapted to the own trade and the selected future.
The CoT-Index is determined according to the formula:
Use:
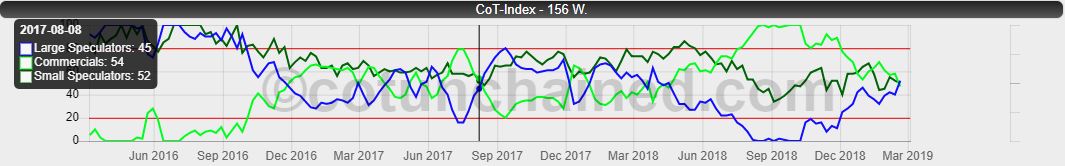
The CoT index gives no signals for a precise time to buy or sell. He only rates the relative
Positioning of market participants in relation to the selected period of the index. Extreme values are usually the
areas below 20% and over 80% assumed. If the indicator reaches 0% or 100% for a selected time frame of 3 years,
so this means that the corresponding merchant group has its most extreme net short or net long positioning in the last
3 years ago. Note: An increase in the net long position can be due both to a reduction of short contracts
as well as by setting up long-term contracts! The CoT index should not be used as an exact timing tool,
because it not infrequently lingers relatively long in extreme areas. It is more like a signaler to
do closer observation of a future.

