
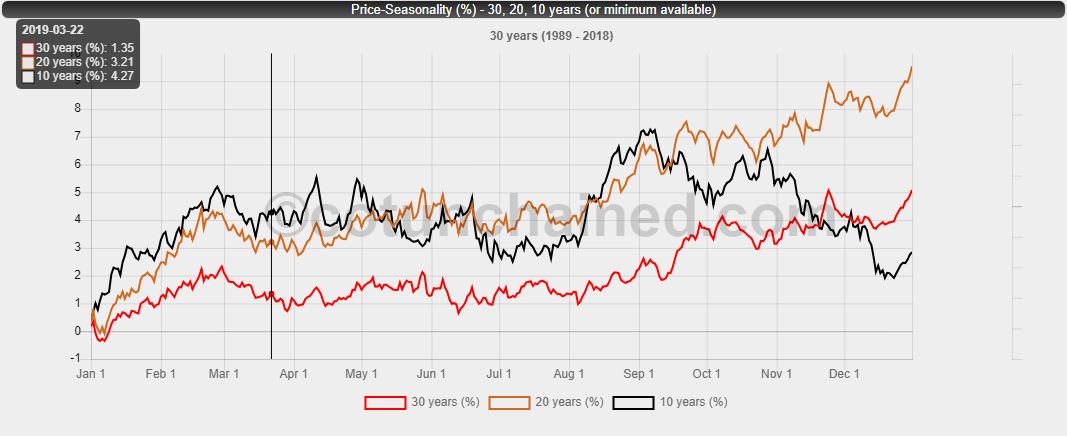
Seasonality charts show an average performance of the underlying during the calendar year. Especially for commodities and currencies often a strong tendency for similar price movements within many calendar years can be noticed. This is of course interrupted by exceptional years (crashes and bubbles) again and again. Usually identifiable in both bear and bull markets. The gold chart (see picture) shows the trend calculated from the average daily (closing price to closing price) relative price changes. Important is in these charts, a correction of the used course data of holidays and weekends. Due to the weekends alone, the number of available daily closing prices is reduced to 5/7 or approx. 71.4%. Leap years and further holidays distort the average values even further. An adjustment of these days is therefore really important! Furthermore, for seasonal charts the relative and not the absolute movements are used. Because inflation alone would otherwise be on a chart representing over 30 or even 50 years averages leading to an extreme overweighting of recent years. The gold price moved e.g. in the years 1985 to 2000 in a total range of about 250 USD. In recent years (until 2019) similar absolute fluctuations were more frequent to observe in a few months. However, the price is around 1300 USD. Many websites only show the history for as long as possible. Mostly 30 to 50 years. However, on closer inspection can be find out that the usual price developments change or shift over the decades. The use of too many years then leads to an unwanted disappearance of the current seasonal patterns. Therefore, a larger database does not necessarily provide the better chart! For this reason, we currently offer the chart for 10, 20 and 30 years. An additional breakdown and consideration of smaller annual blocks, for example to compare the last decades, is planned.
The basis of the calculation are the continuous futures prices (front month). Missing days and weekends courses have been calculated to avoid overweighting the years of not missing the corresponding day. The calculated average relative daily percentage price changes have been merged into a continuous chart. The year-end price of the respective chart thus does not correspond to the average percentage profit per calendar year in the selected future!

